
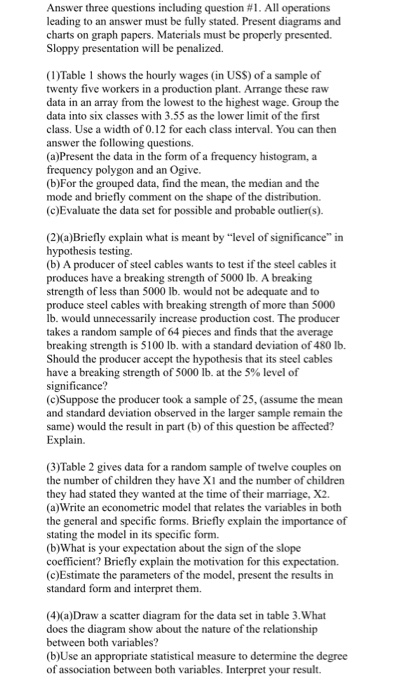
Show transcribed image text Answer three questions including question #1. All operations leading to an answer must be fully stated. Present diagrams and charts on graph papers. Materials must be properly presented. Sloppy presentation will be penalized. (Table shows the hourly wages (in USS) of a sample of twenty five workers in a production plant. Arrange these raw data in an array from the lowest to the highest wage. Group the data into six classes with 3.55 as the lower limit of the first class. Use a width of 0.12 for each class interval. You can then answer the following questions (a)Present the data in the form of a frequency histogram, a frequency polygon and an Ogive (b)For the grouped data, find the mean, the median and the mode and briefly comment on the shape of the distribution. (c)Evaluate the data set for possible and probable outlier(s). (2%a)Briefly explain what is meant by "level of significance" in hypothesis testing (b) A producer of steel cables wants to test if the steel cables it produces have a breaking strength of 5000 lb. A breaking strength of less than 5000 lb. would not be adequate and to produce steel cables with breaking strength of more than 5000 lb. would unnecessarily increase production cost. The producer takes a random sample of 64 pieces and finds that the average breaking strength is 5100 lb. with a standard deviation of 480 lb. Should the producer accept the hypothesis that its steel cables have a breaking strength of 5000 lb. at the 5% level of significance? (c)Suppose the producer took a sample of 25, (assume the mean and standard deviation observed in the larger sample remain the same) would the result in part (b) of this question be affected? Explain. (3)Table 2 gives data for a random sample of twelve couples on the number of children they have XI and the number of children they had stated they wanted at the time of their marriage, X2. (a)Write an econometric model that relates the variables in both the general and specific forms. Briefly explain the importance of stating the model in its specific form. (b)What is your expectation about the sign of the slope coefficient? Briefly explain the motivation for this expectation. (c)Estimate the parameters of the model, present the results in standard form and interpret them (4)(a)Draw a scatter diagram for the data set in table 3.What does the diagram show about the nature of the relationship between both variables? (b)Use an appropriate statistical measure to determine the degree of association between both variables. Interpret your result.
Answer three questions including question #1. All operations leading to an answer must be fully stated. Present diagrams and charts on graph papers. Materials must be properly presented. Sloppy presentation will be penalized. (Table shows the hourly wages (in USS) of a sample of twenty five workers in a production plant. Arrange these raw data in an array from the lowest to the highest wage. Group the data into six classes with 3.55 as the lower limit of the first class. Use a width of 0.12 for each class interval. You can then answer the following questions (a)Present the data in the form of a frequency histogram, a frequency polygon and an Ogive (b)For the grouped data, find the mean, the median and the mode and briefly comment on the shape of the distribution. (c)Evaluate the data set for possible and probable outlier(s). (2%a)Briefly explain what is meant by "level of significance" in hypothesis testing (b) A producer of steel cables wants to test if the steel cables it produces have a breaking strength of 5000 lb. A breaking strength of less than 5000 lb. would not be adequate and to produce steel cables with breaking strength of more than 5000 lb. would unnecessarily increase production cost. The producer takes a random sample of 64 pieces and finds that the average breaking strength is 5100 lb. with a standard deviation of 480 lb. Should the producer accept the hypothesis that its steel cables have a breaking strength of 5000 lb. at the 5% level of significance? (c)Suppose the producer took a sample of 25, (assume the mean and standard deviation observed in the larger sample remain the same) would the result in part (b) of this question be affected? Explain. (3)Table 2 gives data for a random sample of twelve couples on the number of children they have XI and the number of children they had stated they wanted at the time of their marriage, X2. (a)Write an econometric model that relates the variables in both the general and specific forms. Briefly explain the importance of stating the model in its specific form. (b)What is your expectation about the sign of the slope coefficient? Briefly explain the motivation for this expectation. (c)Estimate the parameters of the model, present the results in standard form and interpret them (4)(a)Draw a scatter diagram for the data set in table 3.What does the diagram show about the nature of the relationship between both variables? (b)Use an appropriate statistical measure to determine the degree of association between both variables. Interpret your result.
ScholarMatic: Explanation & Answer
Your ready answer from a verified tutor is just a click away for as little as $14.99


Click Order Now to get 100% Original Answer Customized to your instructions!



