
Key Issues:
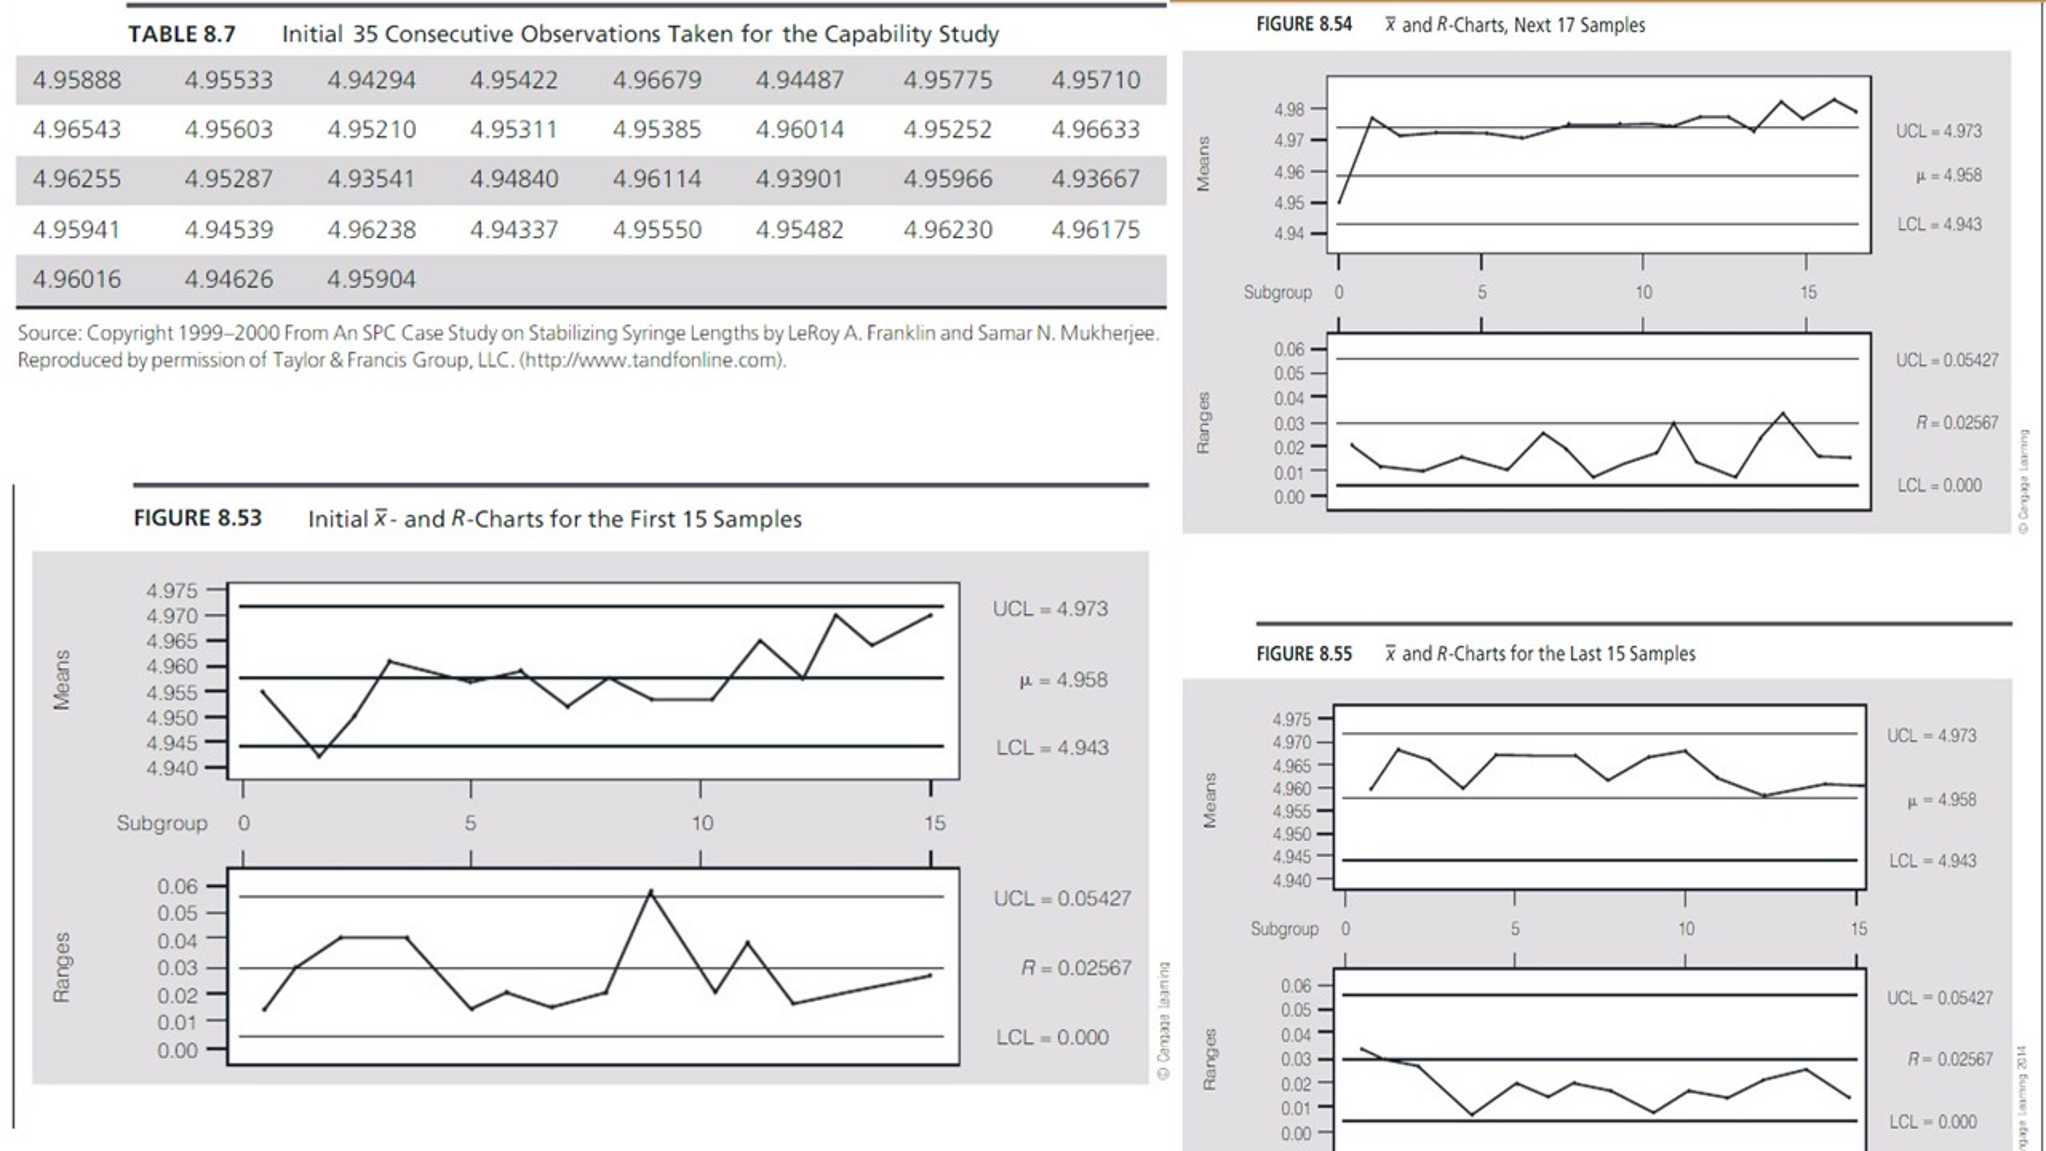
Using the data for the initial process capability study sample
given in Table 8.7, compute the process capability indexes and
construct a histogram for these data.
Explain why it was incorrect that the operators did not plot the
initial data, find special causes, and compute new control limits.
What might have happened had they done it correctly?
What lessons can be learned from this case?
Applying SPC to Pharmaceutical Product
Manufacturing
A Midwest pharmaceutical company manufactures (in two stages)
individual syringes with a self-contained, single dose of an
injectable drug. In the first stage, sterile liquid drug is filled
into glass syringes and sealed with a rubber stopper. The remaining
stage involves insertion of the cartridge into plastic syringes and
the electrical “tacking ” of the containment cap at a
precisely determined length of the syringe. A cap that is “ tacked
” at a shorter than desired length (less than4.920
inches) leads to pressure on the cartridge stop-per and, hence,
partial or complete activation of the syringe. Such syringes must
then be scrapped. If the cap is “ tacked ”
at a longer than desired length(4.980 inches or longer), the
tacking is incomplete or inadequate, which can lead to cap loss and
potentially a cartridge loss in shipment and handling. Such
syringes can be reworked manually to attach the cap at a lower
position. However, this process requires a 100percent inspection of
the tacked syringes and results in increased cost for the items.
This final production step seemed to be producing more and more
scrap and reworked syringes over successive weeks.
At this point, statistical consultants became involved in an
attempt to solve this problem and recommended SPC for the purpose
of improving the tacking operation. The length was targeted as a
critical variable to be monitored by
x – and R -charts, which eventually
led to identifying the root cause of the problem. The actual case
history contains instances in which desired procedures were not
always followed. As such, this case illustrates well the
proper-ties, problems, pitfalls, and peculiarities in applying such
charts, as well as the necessity of having well-trained quality
specialists involved.
Operators of the final stage of this syringe assembly process
were trained in the basics of process capability studies and
control charting techniques. In an attempt to judge the capability
of the process, the responsible technician was called in to adjust
the tacking machine and to position and secure it at what seemed to
be its best possible position. Then, 35 consecutive observations
were taken (see Table 8.7), and a capability study was undertaken.
The process had a sample mean of x
¼ 4.954 inches, which was close to the nominal aim (or
target) of 4.950 inches with a sample standard deviation
of s ¼ 0.0083 inches. Uppe rand
lower specifications of 4.980 and 4.920 inches, respectively, gave
an estimated C pk
¼ 1.03. Thus, it was determined that the process was
minimally capable and could indeed produce the length desired.
To establish the control charts, the operators then collected 15
samples each of size 5 taken every 15minutes. The
x and R -charts are shown in
Figure 8.53.These charts show that the process is already out of
statistical control in both charts. Proper application of SPC
procedures would have indicated that special causes should be
identified and new control limits con-structed. Unfortunately, the
operators from this shift did not plot these points but only used
the control limits they obtained to evaluate future measurements.
The operators from this first shift continued to collect samples of
size 5 every 15 minutes, but due to their unfamiliarity with
charting, they never plotted these15 new points either. At
4:00 P . M . of the same day, a new shift arrived and
operators did plot this second set of 15 points using the control
limits obtained from the first set of 15 points as shown in Figure
8.54. These charts show clearly that the centering was out of
statistical control, with the average length far greater than
desired. This conclusion was substantiated by operators noticing
that the caps were not being tacked properly. The maintenance
technician was immediately called into adjust the machine
properly.
After the first adjustment by the technician, the plot of the
next sample taken 15 minutes later was already beyond the upper
control limit for the x – chart. Thus, the
syringes were still too long, although the technician affirmed that
he had set the height lower just15 minutes earlier. The technician
was recalled to read- just the machine. The second try was no
better, and so the technician was called a third time to adjust the
machine. This third try was successful in the sense that the length
seemed to be reduced enough to have both the
x – and R -values inside their
control limits.
This second shift operators continued sampling and collected 15
additional samples of size 5, at 15-minuteintervals. They plotted
these results (see Figure 8.54),but because no values were beyond
the control limits, they took no action. It was at this point that
the statistical consultants reviewed what had transpired. They not
only determined that the original 15 points used to define
the x – and R
-charts were themselves showing process not under statistical
control, but that the last 15points also showed a process not under
statistical control. The second shift workers had failed to notice
the string of 15 points of the x -chart all
above the centerline and failed to conclude that the center
was “ not where you wanted it. ” If they
had, they would have once again called the technician to adjust the
machine to lower the length of the syringes.
Fortunately, however, the consultants examined the R
-chart as well as the x -chart. Again, the
last14 points of R were all on one side of
the center line, indicating a lack of statistical control. Careful
examination of both charts revealed that the points of
R were below the center and were indicating that the
overall variation had been reduced by what the maintenance
technician had done. Yet, in reading the x
-chart (after examining the R -chart), the length of
the syringes seemed to have increased. The consultants contacted
both the operators and the technician in order to try to find out
what had happened to cause this confusing “ good and bad
” thing to occur. The maintenance technician’s story
was most revealing.
The maintenance technician said that for his first two
(unsuccessful) attempts when he was told to adjust the process
center (length of syringe) down, he moved the height adjustment
stop down on its threaded shaft. However, he found it was difficult
to tighten the locknut for this adjustment stop. The third time
(the successful one), being frustrated that the thread of the shaft
was too battered at the lower end of the stud, he actually moved
the adjustment stop up even though he was asked to make the syringe
lengths shorter. He thought this would result in still longer
syringes being produced, but at least the locknut would hold. When
he was told by the shift that the process was now producing the
proper length syringes and that the operators were satisfied, he
was mystified. He left wondering how a machine adjusted upward
(toward longer lengths) could wind up producing shorter-length
syringes!
The consultants realized th4e dramatic improvement of the
process variation told the important story. When the maintenance
technician set the length of the adjustment cap where he was
supposed to (lower), the threads were so worn as to make it
impossible to hold the locknut in place. Thus, the vibration from
the running machine (within about 15 minutes). Loosened the locknut
and adjustment cap quickly, resulting in drifts off center,
producing syringes of erratic lengths. However, when the
maintenance technician set the adjustment cap higher (which would
make syringes longer), the threads there were good enough for the
locknut to hold the cap in place. The lengths, indeed, were a
little longer than what was targeted, but the variation had been so
dramatically reduced that the overall effect was one of making
acceptable syringes; that is, the syringes were a tiny bit longer
than desired but very consistent in their length so no plotted
points were beyond the upper control limit for the x-chart.
The operators were satisfied with this situation because now the
plotted points of the syringe lengths came under the upper control
limit of the x-chart, which convinced them that they were making
syringes to the proper length. The consultants recommended to the
managers that the threaded stud on which the adjustment stop moved
be replaced. The repair work needed a special part that was fairly
expensive and necessitated some downtime for the manufacturing
process; nevertheless, on the strength of the control chart data
and the explanation of the maintenance technician’s and
consultant’s stories, the recommendation was implemented. Upon
replacement of the threaded sutd, waste and rework from the final
step dropped to virtually zero over the period of many weeks.
Show transcribed image text TABLE 8.7 Initial 35 Consecutive Observations Taken for the Capability Study 4.95888 4.95775 4.95533 4.94294 4.95422 4.96679 4.94487 4.95710 4.96543 4.95603 4.95210 4.95311 4.95385 4.96014 4.95252 4.96633 4.93667 4.96255 4.95966 4.95287 4.93541 4.94840 4.96114 4.93901 4.94539 4.96238 4.94337 4.95550 4.95482 4.96230 4.96175 4.9594 4.96016 4.94626 4.95904 Source: Copyright 1999-2000 From An SPC CaseStudy on Stabilizing Syringe Lengths by LeRoy A.Franklin and Samar N.Mukherjee. Reproduced by permission of Taylor & Francis Group, LLC. (http://www.tandfonline.com FIGURE 8.53 nitial X- and R-Charts for the First 15 Samples 4.975 UCL 4.973 4.970 4.965 4.958 4.955 4.950 4.945 LCL 4.943 4.940 Subgroup 15 UCL 0.05427 0.05 R 0.02567 0.03 0.02 0.0 LCL 0.000 0.00 FIGURE 8.54 X and R-Charts, Next 17 Samples 4.97 Subgroup 0 0.0 FIGURE 8.55 X and R-Charts for the Last 15 Samples 4.975 4.970 4.965 4.945 Subgroup 0 0.0 UCL 4.973 LCL 4.943 UCL 0.05427 R-0,02567 LOL 0.000 UCL 4,973 LCL 4.943 UCL 0.05427 R 0.02567 LCL 0.000
TABLE 8.7 Initial 35 Consecutive Observations Taken for the Capability Study 4.95888 4.95775 4.95533 4.94294 4.95422 4.96679 4.94487 4.95710 4.96543 4.95603 4.95210 4.95311 4.95385 4.96014 4.95252 4.96633 4.93667 4.96255 4.95966 4.95287 4.93541 4.94840 4.96114 4.93901 4.94539 4.96238 4.94337 4.95550 4.95482 4.96230 4.96175 4.9594 4.96016 4.94626 4.95904 Source: Copyright 1999-2000 From An SPC CaseStudy on Stabilizing Syringe Lengths by LeRoy A.Franklin and Samar N.Mukherjee. Reproduced by permission of Taylor & Francis Group, LLC. (http://www.tandfonline.com FIGURE 8.53 nitial X- and R-Charts for the First 15 Samples 4.975 UCL 4.973 4.970 4.965 4.958 4.955 4.950 4.945 LCL 4.943 4.940 Subgroup 15 UCL 0.05427 0.05 R 0.02567 0.03 0.02 0.0 LCL 0.000 0.00 FIGURE 8.54 X and R-Charts, Next 17 Samples 4.97 Subgroup 0 0.0 FIGURE 8.55 X and R-Charts for the Last 15 Samples 4.975 4.970 4.965 4.945 Subgroup 0 0.0 UCL 4.973 LCL 4.943 UCL 0.05427 R-0,02567 LOL 0.000 UCL 4,973 LCL 4.943 UCL 0.05427 R 0.02567 LCL 0.000
ScholarMatic: Explanation & Answer
Your ready answer from a verified tutor is just a click away for as little as $14.99


Click Order Now to get 100% Original Answer Customized to your instructions!



